Scenario: Loan Approval Times for Two Branches
You’re a data analyst at a national bank, and the bank’s management is interested in improving customer service. One of the metrics they’re focusing on is the time it takes to approve a loan application. The bank has recently implemented a new loan processing system at one branch (Branch B) and wants to see if this has led to faster loan approval times compared to the traditional system still in use at another branch (Branch A).
You decide to:
- Randomly select loan applications processed over the last month at both branches.
- Measure the time (in hours) it took from receiving each application to the time the loan was approved.
Hypotheses:
- Null Hypothesis (): The mean loan approval time for Branch A is equal to the mean loan approval time for Branch B.
- Alternative Hypothesis (): The mean loan approval time for Branch A is not equal to the mean loan approval time for Branch B.
Data:
From your analysis, you gather the following data:
Branch A (Traditional System):
-
- Sample Size (): 40
- Sample Mean (): 5 hours
- Sample Standard Deviation (): 1.5 hours
Branch B (New System):
-
- Sample Size (): 45
- Sample Mean (): 4 hours
- Sample Standard Deviation (): 1 hour
Two Independent Sample Test:
Given that the variances (standard deviations squared) might be unequal between the two branches, we can use Welch’s test:
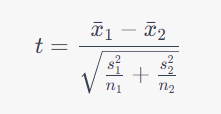
Let’s compute the t test statistic using the provided data.
# Re-entering the data for the banking scenario
n1_branch_a, n2_branch_b = 40, 45 # sample sizes
x1_branch_a, x2_branch_b = 5, 4 # sample means (in hours)
s1_branch_a, s2_branch_b = 1.5, 1 # sample standard deviations (in hours)
# Recalculating the t test statistic for the banking scenario
t_banking = (x1_branch_a – x2_branch_b) / ((s1_branch_a**2 / n1_branch_a + s2_branch_b**2 / n2_branch_b) ** 0.5)
t_banking